When managing Linux systems—whether a small web server or an enterprise-grade VM—real-time performance monitoring is critical. You want to know:
- What’s using your CPU?
- Why is memory spiking?
- Are there zombie processes slowing things down?
Enter htop — the beloved, colorful, interactive process viewer that every Linux admin swears by.
Forget the dull and clunky top command—htop is the modern, user-friendly alternative that gives you clear, live insights into your system’s health with just one command.
🔍 What is htop?
htop is an open-source interactive process monitor for Unix systems. It’s a powerful tool for viewing real-time system metrics like:
- CPU and RAM usage
- Running processes
- System load average
- Swap memory
- Uptime
Unlike the traditional top command, htop lets you navigate using the keyboard, search, sort, and even kill processes — all within its interactive dashboard.
🛠️ How to Install htop in Linux
Installation is super easy on most distributions.
✅ For Ubuntu/Debian:
sudo apt update
sudo apt install htop
✅ For CentOS/RHEL:
sudo yum install htop
✅ For Fedora:
sudo dnf install htop✅ For Arch Linux:
sudo pacman -S htop🚀 Launching htop
Once installed, just type:
htopYou’ll see a beautifully color-coded dashboard with real-time system stats.
Press F10 to quit.
📊 What You See in htop
Here’s what the interface tells you:
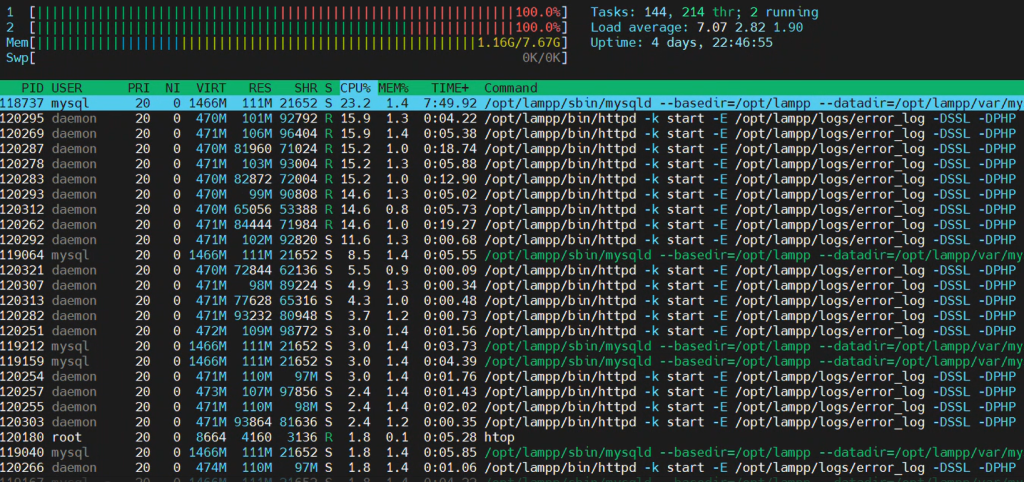
✅ Top Section:
- CPU bars: Per-core CPU usage
- Memory bar: RAM usage
- Swap bar: Swap memory in use
- Load average: 1, 5, and 15-minute system load
- Uptime: How long your system has been running
✅ Bottom Section:
- A list of all running processes, sorted by CPU or memory usage (customizable)
You’ll see columns like:
PID: Process IDUSER: Process owner%CPU: CPU usage%MEM: Memory usageTIME+: Total processor time usedCOMMAND: The process/command running
🎮 Useful Keyboard Shortcuts
| Key | Function |
|---|---|
F1 | Help screen |
F2 | Setup/configuration |
F3 | Search for a process |
F4 | Filter processes |
F5 | Tree view of processes |
F6 | Sort by column |
F9 | Kill process |
F10 | Quit htop |
💡 Use Cases of htop
- 🔍 Debugging high CPU usage
- 🧠 Identifying memory leaks
- 🧹 Killing stuck or zombie processes
- 📊 Viewing system performance at a glance
- 👨💻 Tuning servers and improving application performance
🤝 htop vs top: Why Is htop Better?
| Feature | top | htop |
|---|---|---|
| Colorful UI | ❌ | ✅ |
| Mouse support | ❌ | ✅ |
| Interactive navigation | ❌ | ✅ |
| Tree view | ❌ | ✅ |
| Easy filtering/search | ❌ | ✅ |
| Real-time refresh | Limited | Smooth |
📌 Bonus Tip: Monitor Remote Servers with htop
You can SSH into a remote server and run htop:
ssh user@your-server-ip
htop
Boom 💥 — live server stats in your terminal!