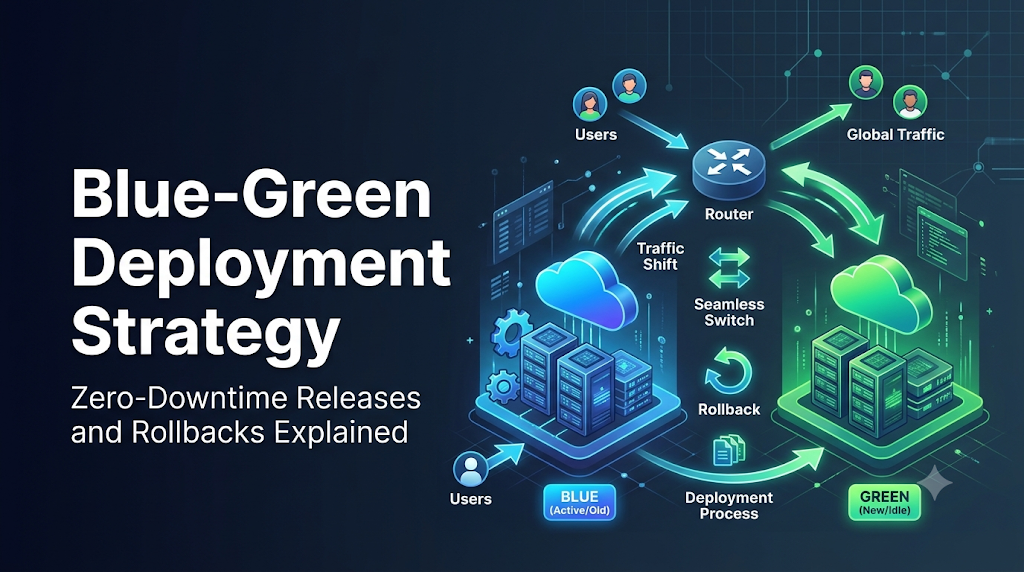
In traditional, in-place software deployments, updating a production service requires stopping live application processes, swapping build artifacts, and restarting services directly on active servers—an error-prone workflow that routinely triggers 502 Bad Gateway errors, drops user sessions, and prolongs recovery during failed releases. Modern engineering practices aim to make deployments predictable, automated, and routine; platforms like DevOpsSchool provide structured learning resources for professionals seeking to master these deployment automation and continuous delivery skills. Among modern production release strategies, blue-green deployment solves the downtime dilemma by decoupling application updates from live traffic activation: teams maintain two identical, isolated environments—an active “Blue” environment serving live users and an idle “Green” environment hosting the new build—enabling thorough validation under real production conditions before a central routing layer shifts traffic instantly, eliminating release downtime and drastically reducing operational risk.
Understand the Blue-Green Deployment Model
The core premise of the blue-green deployment strategy is straightforward: rather than updating software in place on live servers, you maintain two identical, isolated production environments. Only one environment serves live user traffic at any given time, while the other remains idle or serves as a staging target.
                  +-----------------------+
                  |  Production Traffic   |
                  +-----------+-----------+
                              |
                              v
                  +-----------------------+
                  | Traffic Routing Layer |
                  | (Load Balancer/Proxy) |
                  +-----------+-----------+
                              |
              +---------------+---------------+
              |                               |
       (Active Traffic)               (No User Traffic)
              |                               |
              v                               v
    +-------------------+           +-------------------+
    | BLUE ENVIRONMENT  |           | GREEN ENVIRONMENT |
    |   App Version 1   |           |   App Version 2   |
    |  (Currently Live) |           |  (Testing/Staging)|
    +---------+---------+           +---------+---------+
              |                               |
              +---------------+---------------+
                              |
                              v
                  +-----------------------+
                  |    Shared Database    |
                  |     & Data Stores     |
                  +-----------------------+
The Two-Environment Concept
- The Blue Environment: This is the currently active, live production environment. It runs the stable release (for example, Version 1.0) and handles all inbound user traffic routed from the edge.
- The Green Environment: This is an identical, independent environment running alongside Blue. While Blue handles production requests, Green receives the new software release (Version 2.0). Green is isolated from public traffic, allowing engineers and automated testing suites to validate the new version under production-like conditions without impacting live users.
The Role of the Traffic-Routing Layer
Between your end users and these twin environments sits an intelligent traffic-routing layer. This layer can be a hardware load balancer, a cloud load balancer (such as an AWS Application Load Balancer or GCP Cloud Load Balancer), a reverse proxy (such as Nginx, HAProxy, or Envoy), a DNS server, or a Kubernetes Ingress controller.
The routing layer acts as a single point of entry. It evaluates incoming requests and directs them entirely to whichever environment is designated as “active.” When Version 2.0 on the Green environment passes all functional, integration, and operational verifications, the routing layer shifts its target. Within moments, incoming user requests bypass Blue and terminate on Green. Green becomes the new live environment, and Blue transitions into an idle state.
Normally, only one environment receives production traffic at a time. Unlike canary deployments—where traffic is split proportionally across versions—blue-green releases maintain a clean boundary between iterations, preventing complex synchronization issues across different application tiers.
Follow the Deployment From Build to Traffic Switch
A reliable blue-green deployment strategy follows an eight-stage release lifecycle. Each phase is gated to ensure that human error and technical defects cannot spill over into the active user domain.
+------------+     +------------+     +------------+     +------------+
|  1. Build  | --> | 2. Deploy  | --> | 3. Config  | --> | 4. Validate|
|  Artifacts |     |  to Green  |     | Injection  |     |   Health   |
+------------+     +------------+     +------------+     +------------+
                                                               |
+------------+     +------------+     +------------+           |
|  8. Idle   | <-- | 7. Monitor | <-- | 6. Traffic | <---------+
| Retain/Rec |     | Telemetry  |     |   Switch   |
+------------+     +------------+     +------------+
Stage 1: Prepare the New Application Build
The delivery pipeline checks out version-controlled code, executes unit tests, builds standalone binary artifacts or container images, and publishes them to a centralized artifact repository or container registry. The build artifact is cryptographically tagged (e.g., app:v2.0.0-commitsha) to ensure immutability.
Stage 2: Deploy to the Inactive Environment
The deployment automation identifies which environment is currently idle. Assuming Blue is live, the orchestrator targets Green. It deploys the newly built application packages or spins up updated container tasks on the Green infrastructure without modifying the Blue environment.
Stage 3: Configure Required Application Settings
Environment-specific variables, dynamic feature toggles, API keys, and connection credentials are injected into the Green environment. This injection is performed using centralized configuration management platforms or container secret stores, ensuring Green mirrors production runtime parameters.
Stage 4: Run Smoke, Integration, and Health Checks
Before exposing Green to external traffic, automated testing frameworks run validation suites against internal endpoints. These checks verify:
- Database connection pooling and read/write capabilities.
- Network reachability of downstream internal APIs.
- Proper initialization of application caches and background daemons.
- Execution of core synthetic user flows (e.g., login, search, add-to-cart).
Stage 5: Validate Dependencies and Operational Readiness
In addition to automated tests, internal stakeholders or automated gatekeepers assess operational telemetry. If manual approval gates are part of corporate governance, QA leads or release managers review validation dashboards and explicitly approve the release.
Stage 6: Switch Production Traffic to the New Environment
The traffic-routing layer updates its upstream targets. In a reverse proxy or load balancer, this involves pointing the target group from the Blue IP addresses/ports to the Green IP addresses/ports. In Kubernetes, this is achieved by updating a Service selector. New connections immediately terminate on the Green environment.
Stage 7: Monitor Application Behavior
With traffic hitting Green, real-time monitoring kicks in. Site Reliability Engineers (SREs) and automated canary-analysis daemons track error rates, HTTP response codes, latency percentiles, memory consumption, and transaction volumes.
Stage 8: Retain the Previous Environment Temporarily for Recovery
The Blue environment is neither terminated nor modified immediately. It remains standing in an idle state for a defined operational window (e.g., 2 to 24 hours). If an unexpected defect emerges under real-world production load, the routing layer can switch back to Blue in seconds. Once confidence in Green is solidified, Blue is powered down or designated as the staging target for the next release cycle.
What Must Be Ready Before the Switch?
Achieving zero downtime during a blue-green switch requires thorough preparation. If underlying infrastructure components fall out of sync, the traffic switch can trigger unexpected failures even when the application code itself is completely free of bugs.
Checklist for Blue-Green Readiness:
[x] Environment Parity (OS, Kernel, Libraries, Runtimes)
[x] Symmetrical Compute Capacity (CPU, Memory, IOPS)
[x] Consistent Application Configurations & Environment Variables
[x] Synchronized Secrets, Tokens, and Network Firewalls
[x] Deep Health Checks Passing on Inactive Target
[x] Centralized Metrics, Logs, and Rollback Procedures Validated
1. Environment Consistency (Parity)
Blue and Green must be structurally identical. Discrepancies in operating system versions, kernel patches, container runtime engines, installed system libraries, or network interface tuning will cause subtle, hard-to-diagnose production bugs. Using Infrastructure as Code (IaC) tools such as Terraform, OpenTofu, or Ansible ensures both environments are provisioned from the same immutable declarations.
2. Infrastructure Capacity
Both environments must provide equivalent compute, memory, disk I/O, and network throughput. If the Blue environment consists of 16 application nodes running behind a load balancer, the Green environment cannot cut corners with 8 nodes during testing and expect to absorb 100% of production traffic without suffering immediate resource exhaustion and latency spikes.
3. Application Configuration and Secrets
Externalized application configuration must be synchronized. Secrets, private keys, database passwords, and third-party API credentials must be deployed to the Green environment prior to the switch. If an updated API token exists only on Blue, the newly activated Green environment will fail immediately upon receiving live requests.
4. Network and Routing Rules
Firewalls, cloud security groups, and routing tables must permit Green instances to communicate with every supporting internal dependency, such as message brokers (Kafka, RabbitMQ), shared caches (Redis, Memcached), and external payment gateways. A common pitfall is locking down security groups so tightly that Blue can talk to the database, but Green is blocked by a CIDR or security-group mismatch.
5. Health Checks and Telemetry
The load balancer must rely on “deep” health checks rather than shallow port pings. A shallow health check only verifies that port 8080 is open; a deep health check queries a dedicated endpoint (e.g., /healthz or /ready) that verifies active database connectivity, disk write access, and memory headroom.
6. Rollback Readiness
The rollback procedure must be documented, automated, and tested. Every team member participating in the release must understand the exact command, API call, or dashboard action required to redirect traffic back to Blue if unrecoverable errors occur.
The Traffic-Switching Decision
The defining mechanism of a blue-green release is how production traffic moves from one environment to the other. Several architectural patterns exist to accomplish this switch, each carrying specific tradeoffs in propagation speed, session stability, and operational complexity.
+-----------------------------------------------------------------------------------+
|                           TRAFFIC SWITCHING MECHANISMS                            |
+--------------------------+-----------------------+--------------------------------+
| Mechanism                | Switching Speed       | Key Tradeoff                   |
+--------------------------+-----------------------+--------------------------------+
| DNS Record Update        | Slow (Minutes/Hours)  | Client TTL caching delays      |
| Load Balancer Target Swap| Fast (Sub-second)     | Requires upstream proxy layer  |
| Reverse Proxy Reload     | Fast (Milliseconds)   | Requires config reload         |
| K8s Service Selector     | Instant (API call)    | Limited to Kubernetes clusters |
+--------------------------+-----------------------+--------------------------------+
1. Load Balancer Target Group Swapping
In cloud and enterprise data center environments, application instances sit behind an Application Load Balancer (ALB). The load balancer has a listener rule pointing to a “Target Group.”
- Mechanism: The switch is executed by modifying the listener rule to point its default forwarding action from the Blue Target Group to the Green Target Group via the load balancer’s API.
- Characteristics: Extremely fast (typically a few seconds). It maintains active connections while routing all new requests to Green.
2. Reverse Proxy Reconfiguration (Nginx / HAProxy / Envoy)
For teams operating their own routing tiers, software reverse proxies manage traffic flows.
- Mechanism: The proxy configuration maintains an
upstreamblock pointing to the IP addresses of the application backends. To switch, an automated script updates the upstream configuration file to point to Green’s backend IPs and issues a graceful configuration reload signal (e.g.,nginx -s reload). - Characteristics: The master process validates the new syntax, spins up new worker processes pointing to Green, and gracefully winds down old workers once their existing client connections complete. Downtime is effectively zero.
3. DNS-Based Switching
Under this approach, the public DNS record (e.g., api.example.com) is an A, AAAA, or CNAME record pointing to the public IP or hostname of the Blue environment.
- Mechanism: The deployment pipeline updates the DNS record to point to the Green environment’s public endpoint.
- Characteristics & Limitations: DNS-based switching does not guarantee zero downtime. Public DNS resolvers, Internet Service Providers (ISPs), operating systems, and client applications aggressively cache DNS responses, routinely ignoring the Time-to-Live (TTL) setting. If you set a TTL of 60 seconds, some clients will continue sending requests to the old Blue IP address for minutes—or even hours—after the record changes. DNS switching should be reserved for global disaster recovery, not fine-grained application releases.
4. Kubernetes Service Selectors
Within containerized environments orchestrated by Kubernetes, traffic switching is built directly into the control plane.
- Mechanism: A Kubernetes
Serviceabstracts a group of Pods using label selectors:YAMLapiVersion: v1 kind: Service metadata: name: web-app-service spec: selector: app: web-app version: "v1.0" # Points to Blue Pods ports: - protocol: TCP port: 80 targetPort: 8080To switch to Green, the pipeline updates the label selector fromversion: "v1.0"toversion: "v2.0". - Characteristics: The Kubernetes API Server updates the internal endpoints object. Kube-proxy instances and ingress controllers immediately update their IP tables or routing meshes, redirecting traffic to the Green Pods without terminating client connections.
Connection Draining and Session Handling
Regardless of the switching mechanism, two operational factors must be managed:
- Connection Draining (Deregistration Delay): When Blue is disconnected, in-flight HTTP requests must not be severed abruptly. The routing layer must enter a “draining” state, allowing active TCP sockets to finish sending responses while directing all new connection requests to Green.
- Session Persistence (Sticky Sessions): If your application stores session state in local server memory rather than a shared cache (like Redis), switching traffic will invalidate active user sessions, forcing users to log in again. Stateless application architectures are fundamentally easier to manage in blue-green workflows.
Database Changes: The Part Teams Must Plan Carefully
Application code is transient and stateless; databases are persistent and stateful. This single distinction makes database schema evolution the most challenging aspect of blue-green deployments.
The Common Database Dilemma:
Both Blue (v1.0) and Green (v2.0) must access the SAME database concurrently during the switch!
                      +-----------------------+
                      |    Shared Database    |
                      +-----------+-----------+
                                  ^
                     +------------+------------+
                     |                         |
            +--------+--------+       +--------+--------+
            |  App v1 (Blue)  |       |  App v2 (Green) |
            | Expects: name   |       | Expects:        |
            |                 |       | first_name,     |
            |                 |       | last_name       |
            +-----------------+       +-----------------+
When you deploy the Green environment, it connects to the same shared production database as the Blue environment. During the testing phase on Green, and throughout the transition window, both application versions run simultaneously against the same schema.
If Version 2.0 requires a destructive database change—such as deleting a column, renaming a table, or changing a data type—applying that migration immediately breaks the currently running Blue application, triggering an instant production outage.
To resolve this, database migrations in a blue-green strategy must strictly follow the Expand-and-Contract Pattern (also known as the Parallel Run or Add-Then-Drop Pattern).
The Expand-and-Contract Migration Pattern
This pattern separates database changes into distinct, backward-compatible phases executed across multiple releases.
Scenario: Splitting a Field
Suppose your application has an accounts table with a column called full_name. Your new application version (v2.0) needs to store first_name and last_name separately.
Phase 1 (Expand): Database has full_name, first_name, last_name.
Phase 2 (Migrate): Both versions can read and write data safely.
Phase 3 (Contract): After v2.0 is fully verified, drop full_name.
Step 1: Expand Phase (Release N)
- You apply a non-breaking database migration that adds two new nullable columns:
first_nameandlast_name. - The existing column
full_nameremains untouched. - The running Blue application (v1.0) ignores the new columns and functions normally.
- An asynchronous background database script or database trigger populates
first_nameandlast_namebased on existingfull_namedata.
Step 2: Parallel Operation Phase (Release N+1 – The Green Release)
- The new version of the application (v2.0) is written to write to both
full_nameand the new columns (first_name,last_name). If it needs to read, it reads from the new columns, falling back tofull_nameif they are empty. - You deploy v2.0 to the Green environment and switch traffic.
- Why this matters for rollback: If Green experiences an application bug and you must switch traffic back to Blue, Blue will not crash. Because v2.0 maintained writes to the legacy
full_namecolumn, Blue’s schema assumptions remain intact!
Step 3: Contract Phase (Release N+2)
- Once Version 2.0 has been running in production for several days without incident, you deploy an update that removes the fallback code.
- Finally, you apply a migration that drops the legacy
full_namecolumn from the database.
Core Database Rules for Blue-Green Deployments
- Never Make Breaking Changes in a Single Step: Never rename columns, change column types, or drop tables in a release that depends on those changes immediately.
- All New Fields Must Be Optional: New columns added to a shared database must be nullable or include sensible default values; otherwise,
INSERTqueries executed by the legacy Blue version will throw constraint errors. - Decouple Migrations from the Application Switch: Database migrations should be executed as a separate pipeline step before the Green environment is brought up, ensuring the schema can comfortably support both iterations.
- Remember the Reality of Rollbacks: Switching the routing layer back to Blue only rolls back the application logic. It does not undo records written or modified by Green while it was live.
A Practical Implementation Using Docker and Nginx
To see how blue-green deployment works under the hood, let’s build a functional, local implementation using Docker containers and an Nginx reverse proxy.
                          +-------------------+
                          | Client Requests   |
                          | (http://localhost)|
                          +---------+---------+
                                    |
                                    v
                          +-------------------+
                          |   Nginx Proxy     |
                          |  (Port 80/Host)   |
                          +---------+---------+
                                    |
                    +---------------+---------------+
                    | (Current Active Target)       | (Idle / Inactive)
                    v                               v
          +-------------------+           +-------------------+
          |  web-blue (v1.0)  |           |  web-green (v2.0) |
          |   (Port 8081)     |           |   (Port 8082)     |
          +-------------------+           +-------------------+
Prerequisites
- Docker installed on your workstation.
- Basic familiarity with command-line interfaces.
- A clean working directory.
Step 1: Create the Application Versions
For our application, we will use lightweight Nginx containers serving distinct HTML files representing Version 1.0 (Blue) and Version 2.0 (Green).
Create a directory structure:
Bash
mkdir -p blue-green-demo/{blue,green,nginx}
cd blue-green-demo
Create the Blue application file (blue/index.html):
HTML
<!DOCTYPE html>
<html>
<head>
    <title>Production System</title>
    <style>
        body { font-family: sans-serif; text-align: center; margin-top: 10%; background: #e6f0fa; }
        h1 { color: #0056b3; font-size: 3rem; }
    </style>
</head>
<body>
    <h1>Application Version 1.0 (BLUE)</h1>
    <p>Status: Live Production Traffic</p>
</body>
</html>
Create the Green application file (green/index.html):
HTML
<!DOCTYPE html>
<html>
<head>
    <title>Production System</title>
    <style>
        body { font-family: sans-serif; text-align: center; margin-top: 10%; background: #eafaf1; }
        h1 { color: #1e7e34; font-size: 3rem; }
    </style>
</head>
<body>
    <h1>Application Version 2.0 (GREEN)</h1>
    <p>Status: Updated Production Traffic</p>
</body>
</html>
Step 2: Configure the Routing Layer (Nginx)
Create the initial Nginx configuration file (nginx/nginx.conf). Here, we configure an upstream block named app_servers that points directly to our active environment. Initially, this is the Blue container.
Nginx
events { worker_connections 1024; }

http {
    upstream app_servers {
        # Active Environment: Blue
        server web-blue:80;

        # Inactive Environment: Green (Commented out initially)
        # server web-green:80;
    }

    server {
        listen 80;

        location / {
            proxy_pass http://app_servers;
            proxy_set_header Host $host;
            proxy_set_header X-Real-IP $remote_addr;
            proxy_set_header X-Forwarded-For $proxy_add_x_forwarded_for;

            # Connection tuning to support graceful switching
            proxy_connect_timeout 2s;
            proxy_read_timeout 5s;
        }
    }
}
Step 3: Define the Multi-Container Architecture
Create a docker-compose.yml file in the root directory to manage the network and services:
YAML
version: '3.8'

services:
  web-blue:
    image: nginx:alpine
    container_name: web-blue
    volumes:
      - ./blue:/usr/share/nginx/html:ro
    networks:
      - app-network

  web-green:
    image: nginx:alpine
    container_name: web-green
    volumes:
      - ./green:/usr/share/nginx/html:ro
    networks:
      - app-network

  proxy:
    image: nginx:alpine
    container_name: router-proxy
    ports:
      - "80:80"
    volumes:
      - ./nginx/nginx.conf:/etc/nginx/nginx.conf:ro
    depends_on:
      - web-blue
      - web-green
    networks:
      - app-network

networks:
  app-network:
    driver: bridge
Step 4: Start the Initial Production Environment
Launch the stack:
Bash
docker compose up -d
Verify that all three containers are healthy:
Bash
docker compose ps
Now, query the routing proxy:
Bash
curl http://localhost
Expected Output:
HTML
<!DOCTYPE html>
<html>
...
    <h1>Application Version 1.0 (BLUE)</h1>
    <p>Status: Live Production Traffic</p>
...
</html>
All production traffic passes through the proxy on port 80 and is routed to the Blue container.
Step 5: Validate the Inactive Environment (Green)
Before altering the production proxy, verify that the Green container is running and functional within the Docker network:
Bash
docker compose exec proxy curl -s http://web-green:80 | grep "Version"
Expected Output:
HTML
<h1>Application Version 2.0 (GREEN)</h1>
Green is fully operational and ready to accept live users.
Step 6: Execute the Traffic Switch to Green
Update your nginx/nginx.conf file to route traffic to web-green instead of web-blue:
Nginx
events { worker_connections 1024; }

http {
    upstream app_servers {
        # Inactive Environment: Blue
        # server web-blue:80;

        # Active Environment: Green
        server web-green:80;
    }

    server {
        listen 80;
        location / {
            proxy_pass http://app_servers;
            proxy_set_header Host $host;
            proxy_set_header X-Real-IP $remote_addr;
        }
    }
}
Instruct Nginx to reload its configuration gracefully without dropping connections:
Bash
docker compose exec proxy nginx -s reload
Now, re-run your curl request:
Bash
curl http://localhost
Expected Output:
HTML
<!DOCTYPE html>
<html>
...
    <h1>Application Version 2.0 (GREEN)</h1>
    <p>Status: Updated Production Traffic</p>
...
</html>
The switch is complete. Traffic shifted to Version 2.0 instantaneously, without restarting the proxy container or dropping a single socket.
Step 7: Performing an Instant Rollback
Suppose a critical bug is reported in Version 2.0. To execute an immediate rollback:
- Edit
nginx/nginx.confto swap the active server back toserver web-blue:80;. - Run
docker compose exec proxy nginx -s reload. - Within milliseconds,
curl http://localhostreturns the stable Version 1.0 Blue page.
Automating Blue-Green Releases Through CI/CD
Performing manual configuration updates during a release introduces the potential for human error. A mature Continuous Integration and Continuous Deployment (CI/CD) pipeline automates every step of the blue-green workflow, providing auditability, consistency, and speed.
Typical CI/CD Pipeline Workflow:
[Code Commit]
      │
      ▼
[Run Unit Tests & Build Container Image]
      │
      ▼
[Query Deployment State: Identify Inactive Target]
      │
      ▼
[Deploy New Image to Inactive Target (e.g., Green)]
      │
      ▼
[Execute Automated Health Checks & Integration Tests]
      │
      ▼
[Approval Gate: Manual or Automated Metric Verification]
      │
      ▼
[Update Traffic Routing Layer (Load Balancer / Service Selector)]
      │
      ▼
[Post-Release Synthetic Checks: Pass -> Keep Green Live | Fail -> Rollback to Blue]
Pipeline Implementation (GitHub Actions Example)
Here is a declarative GitHub Actions workflow illustrating how a pipeline manages environment discovery, deployment, validation, and traffic switching using an AWS Application Load Balancer:
YAML
name: Production Blue-Green Deployment

on:
  push:
    branches:
      - main

env:
  AWS_REGION: us-east-1
  IMAGE_NAME: my-app
  PROD_LISTENER_ARN: arn:aws:elasticloadbalancing:us-east-1:123456789012:listener/app/my-alb/12345
  BLUE_TG_ARN: arn:aws:elasticloadbalancing:us-east-1:123456789012:targetgroup/blue-tg/11111
  GREEN_TG_ARN: arn:aws:elasticloadbalancing:us-east-1:123456789012:targetgroup/green-tg/22222

jobs:
  build-and-test:
    runs-on: ubuntu-latest
    outputs:
      image_tag: ${{ steps.vars.outputs.tag }}
    steps:
      - name: Checkout Code
        uses: actions/checkout@v4

      - name: Run Test Suite
        run: |
          npm ci
          npm test

      - name: Build Container Image
        id: vars
        run: |
          TAG=$(git rev-parse --short HEAD)
          docker build -t $IMAGE_NAME:$TAG .
          echo "tag=$TAG" >> $GITHUB_OUTPUT
          # Push to registry (e.g., AWS ECR or Docker Hub)

  deploy-to-inactive:
    needs: build-and-test
    runs-on: ubuntu-latest
    steps:
      - name: Configure AWS Credentials
        uses: aws-actions/configure-aws-credentials@v4
        with:
          aws-access-key-id: ${{ secrets.AWS_ACCESS_KEY_ID }}
          aws-secret-access-key: ${{ secrets.AWS_SECRET_ACCESS_KEY }}
          aws-region: ${{ env.AWS_REGION }}

      - name: Determine Active Environment
        id: check-active
        run: |
          # Query the load balancer to determine the currently routed target group
          CURRENT_TG=$(aws elbv2 describe-rules \
            --listener-arn $PROD_LISTENER_ARN \
            --query "Rules[?IsDefault].Actions[0].TargetGroupArn" \
            --output text)

          if [ "$CURRENT_TG" == "$BLUE_TG_ARN" ]; then
            echo "active=blue" >> $GITHUB_OUTPUT
            echo "target=green" >> $GITHUB_OUTPUT
            echo "target_arn=$GREEN_TG_ARN" >> $GITHUB_OUTPUT
          else
            echo "active=green" >> $GITHUB_OUTPUT
            echo "target=blue" >> $GITHUB_OUTPUT
            echo "target_arn=$BLUE_TG_ARN" >> $GITHUB_OUTPUT
          fi

      - name: Deploy to Inactive Environment
        run: |
          TARGET_ENV=${{ steps.check-active.outputs.target }}
          echo "Deploying version ${{ needs.build-and-test.outputs.image_tag }} to $TARGET_ENV environment..."
          # Command to deploy updated containers to the designated target group

      - name: Execute Internal Smoke Checks
        run: |
          echo "Running synthetic smoke tests against inactive environment endpoints..."
          # Run tests against internal IP / non-production DNS

  switch-traffic:
    needs: deploy-to-inactive
    runs-on: ubuntu-latest
    steps:
      - name: Switch Load Balancer Listener Rule
        run: |
          TARGET_ARN=${{ needs.deploy-to-inactive.outputs.target_arn }}
          echo "Switching live traffic to Target Group: $TARGET_ARN"
          aws elbv2 modify-listener \
            --listener-arn $PROD_LISTENER_ARN \
            --default-actions Type=forward,TargetGroupArn=$TARGET_ARN

      - name: Post-Switch Telemetry Validation
        run: |
          echo "Evaluating error rates on production listener..."
          # If HTTP 5xx errors spike over 1%, trigger automated rollback step
Rollback: Returning Traffic to the Previous Version
Even with automated testing, bugs related to edge-case data, unexpected traffic patterns, or race conditions can emerge once real users hit the application. When this happens, blue-green deployment provides an exceptionally fast recovery path.
          +-------------------------------------------------------+
          |           UNEXPECTED PRODUCTION DEFECT DETECTED        |
          +---------------------------+---------------------------+
                                      |
                                      v
          +-------------------------------------------------------+
          | Step 1: Execute Reverse Routing Switch (Redirect to Blue)
          +---------------------------+---------------------------+
                                      |
                                      v
          +-------------------------------------------------------+
          | Step 2: Confirm Active Sessions & Health on Old Stack  |
          +---------------------------+---------------------------+
                                      |
                                      v
          +-------------------------------------------------------+
          | Step 3: Preserve Green State, Logs, Dumps for Post-Mortem
          +---------------------------+---------------------------+
                                      |
                                      v
          +-------------------------------------------------------+
          | Step 4: Evaluate Database Schema & Data Integrity     |
          +-------------------------------------------------------+
The Rollback Lifecycle
- Detection: Automated alarms (such as Datadog, CloudWatch, or Prometheus Alertmanager) detect an elevated 5xx error budget burn or a latency regression.
- Traffic Reversal: The pipeline or on-call engineer triggers the rollback command. The load balancer, reverse proxy, or Kubernetes Service selector flips traffic back to the Blue environment.
- Verification: Live monitoring confirms that traffic has shifted back to Blue, and error rates return to normal baseline levels.
- Evidence Preservation: Because the failed Green environment was not modified during the rollback, it remains intact. Engineers can inspect the running Green containers, capture heap dumps, extract uncommitted log buffers, and reproduce bugs directly without affecting customer traffic.
- Teardown and Recovery: Once the post-mortem analysis data is collected, the Green environment is drained, stopped, or reset.
Distinguishing Rollback Layers
Teams must recognize the structural boundaries between different types of rollbacks:
- Application Rollback: Reverting the routing layer to point to the older application environment. This takes seconds and carries minimal operational risk.
- Infrastructure Rollback: Rebuilding or reverting compute, networking, or operating-system-level changes. This is avoided during active incidents by keeping the old environment online.
- Database Recovery: Reverting schema changes or data modifications. This is fundamentally separate from application rollback. If Green processed orders for 10 minutes before the rollback, rolling back the application code does not undo the database transactions written during that period. Attempting to restore a database snapshot taken prior to deployment will erase legitimate customer transactions. This reinforces why non-breaking, expand-and-contract migrations are required.
Monitoring the New Environment After Release
Monitoring a blue-green deployment is not a single post-release task; it is an active verification process divided into two phases: Pre-Switch Validation and Post-Switch Verification.
Pre-Switch (Green Only)               Post-Switch (All Production)
+-------------------------------+     +-------------------------------+
| * Endpoint /healthz = 200 OK  |     | * Error Rate < 0.05%          |
| * DB Connection Pool Active   | --> | * P95/P99 Latency Stable      |
| * Cache Warming Completed     |     | * CPU/Memory within limits    |
| * Smoke Tests Pass (0 fails)  |     | * Business Conversions Normal |
+-------------------------------+     +-------------------------------+
Primary Telemetry Signals to Monitor
1. HTTP Error Rates (4xx and 5xx Codes)
A sudden rise in 500 Internal Server Error, 502 Bad Gateway, or 503 Service Unavailable responses indicates runtime crashes or unmet downstream dependencies. Similarly, an abnormal spike in 400 Bad Request or 404 Not Found responses may point to broken API contracts or routing misconfigurations.
2. Latency Distributions (P95, P99 Percentiles)
Average response times can hide serious performance degradations. Monitor high-percentile metrics ($p95$, $p99$). A high $p99$ latency indicates that specific operations or database queries are experiencing locks or connection pool exhaustion.
3. Compute Resource Utilization
Track CPU usage, memory consumption (to spot leaks), socket allocations, and disk I/O across the newly active Green hosts. If memory ramps up linearly under load, the new version may have a memory leak that will cause an Out-Of-Memory (OOM) kill.
4. Database Metrics
Monitor active connection pools, lock wait times, query execution latency, and slow query logs. Incompatible or unindexed queries generated by the new application version can quickly exhaust database connections.
5. User-Facing Business Metrics
Technical metrics alone do not tell the whole story. Monitor key performance indicators such as successful logins per minute, order completions, cart checkouts, or external payment webhook receipts. If technical dashboards are green but completed orders drop to zero, an application bug is blocking business flows.
6. Centralized Logging
Use structured logging pipelines (Elasticsearch/Logstash/Kibana, Grafana Loki, or Splunk). Filter for log entries with level FATAL or ERROR originating specifically from the Green environment.
Blue-Green vs Canary vs Rolling Deployment
Choosing the right deployment pattern requires matching your infrastructure, data architecture, and risk tolerance to the appropriate strategy.
+---------------------------------------------------------------------------------------------------+
| Strategy      | Visual Traffic Mechanism                                                          |
+---------------+-----------------------------------------------------------------------------------+
| Blue-Green    | All [Traffic] ------------> [Blue (v1)]  == Switch ==>  [Green (v2)]              |
| Canary        | [Traffic] -- 90% --> [v1 (Base)]  &  -- 10% --> [v2 (Canary)]                     |
| Rolling       | [Traffic] ---------> Node 1 (v2), Node 2 (v1), Node 3 (v1) ... (Stepwise Upgrade) |
+---------------------------------------------------------------------------------------------------+
Comprehensive Comparison Table
| Attribute | Blue-Green Deployment | Canary Deployment | Rolling Deployment |
| Deployment Approach | Provisions two complete, isolated environments; switches traffic entirely from one to the other. | Deploys new version to a small subset of instances; routes a small fraction of users, then ramps up. | Progressively updates instances or Pods within a single fleet until all nodes run the new version. |
| Traffic Exposure | 100% immediate switch from Old to New. | Gradual (e.g., 2% → 10% → 50% → 100%). | Mixed; requests hit either old or new instances depending on load balancer round-robin. |
| Infrastructure Overhead | High: Requires up to 200% peak compute capacity during the release window. | Low: Requires only a small amount of extra capacity to run the canary instances. | Minimal: Requires zero or minimal extra capacity (e.g., Kubernetes maxSurge). |
| Rollback Behavior | Instant: Re-point the load balancer/proxy back to the idle old environment. | Fast: Terminate canary instances and route 100% of traffic back to baseline fleet. | Slow: Requires executing an in-place rolling update back to the old version across the fleet. |
| Operational Complexity | Medium; challenging database management and environment parity. | High; requires advanced traffic splitting, metric analysis, and service mesh tools. | Low-to-Medium; supported natively by container platforms like Kubernetes out of the box. |
| Best Suited For | Monoliths, web applications, mission-critical systems requiring instant rollback. | High-traffic distributed systems, microservices, continuous delivery at scale. | Resource-constrained environments, internal tools, non-critical background services. |
Strategic Tradeoffs
- Blue-Green Deployment offers the fastest recovery time. Because the old environment remains untouched, rolling back takes seconds. However, it requires either maintaining duplicate infrastructure or using dynamic cloud provisioning to spin up and tear down environments on demand.
- Canary Deployment minimizes blast radius. If a bug is introduced, only a tiny fraction of your user base encounters it. However, it requires maintaining mixed-version environments for hours, which increases operational overhead and requires advanced routing layers (e.g., Istio, Linkerd, AWS App Mesh).
- Rolling Deployment is the default for Kubernetes deployments because it is resource-efficient. It gradually updates pods without needing duplicate clusters. Its primary disadvantage is that a rollback requires another rolling deployment, leaving your fleet running mixed versions during failures.
Where Blue-Green Deployment Works Well—and Where It Becomes Difficult
                      +---------------------------------------+
                      |       IS BLUE-GREEN RIGHT FOR YOU?    |
                      +-------------------+-------------------+
                                          |
                 +------------------------+------------------------+
                 |                                                 |
                 v                                                 v
    [ IDEAL USE CASES ]                               [ HIGH-FRICTION CHALLENGES ]
    * Stateless Web Apps & APIs                       * Monolithic Stateful Apps
    * Regulated / High-Availability Services          * High Infrastructure Costs
    * Systems with Strict Downtime SLAs               * Heavy / Destructive DB Changes
    * Environments with Strong IaC Parity             * Long-Lived Client Connections
Ideal Use Cases
- Stateless Web Applications and Microservices: Services that externalize their session state to Redis, Memcached, or managed distributed databases work seamlessly.
- APIs with Strict Service Level Agreements (SLAs): Financial, healthcare, and enterprise platforms where even five minutes of deployment downtime carries severe business or contractual penalties.
- Mission-Critical Releases Requiring Guaranteed Rollbacks: Scenarios where a delayed rollback during an incident could result in major financial loss.
- Environments with Strong Infrastructure as Code: Teams using Terraform, Pulumi, or automated container platforms that can spin up identical environments on demand without configuration drift.
High-Friction Challenges and How to Mitigate Them
1. Duplicate Infrastructure Costs
- Challenge: Running two parallel production environments doubles compute and license costs during deployment windows.
- Mitigation: In cloud environments, use dynamic scaling. Use automation scripts to spin up Green instances just before testing, switch traffic, and shut down Blue after a 2-hour observation window. This keeps duplicate infrastructure costs limited to the deployment period.
2. Stateful Applications and Local Files
- Challenge: Applications that write user-uploaded files, temporary media, or local state to local disk storage will lose access to those assets during a traffic switch.
- Mitigation: Decouple state entirely. Store uploaded media in centralized object storage (e.g., AWS S3, Google Cloud Storage, or MinIO) and mount shared network file systems (e.g., NFS, AWS EFS) where shared disk access is mandatory.
3. Long-Running Asynchronous Jobs and WebSockets
- Challenge: Abruptly switching traffic will sever persistent connections (e.g., streaming connections, WebSockets) and interrupt background processing jobs.
- Mitigation: Implement intelligent connection draining on your load balancer. Allow background job processors on the Blue environment to finish their current job queues before shutting down workers, while directing all new job queue submissions to Green.
4. External Webhooks and Third-Party Integrations
- Challenge: Third-party payment gateways and identity providers may send event webhooks to static IP addresses or callback URLs.
- Mitigation: Ensure your traffic router or API Gateway sits at a permanent public IP or URL. The public-facing entry point remains completely static, while the internal routing switches between Blue and Green.
Frequently Asked Questions
What is blue-green deployment in DevOps?
Blue-green deployment is a production release management strategy in which two identical environments—Blue (the active production environment) and Green (the inactive testing environment)—run in parallel. Updates are deployed and validated on the Green environment before a traffic-routing layer switches live user traffic to Green, achieving zero downtime and enabling rapid rollbacks.
Why are two environments required?
Two environments are required to decouple application deployment from production activation. By deploying to an isolated, inactive environment, teams can run realistic integration, security, and performance tests on production-grade infrastructure without exposing end users to deployment bugs, partial configuration states, or runtime initialization delays.
Does blue-green deployment guarantee zero downtime?
Blue-green deployment minimizes application delivery downtime, but it does not automatically guarantee zero downtime across every architecture. If database migrations introduce table locks, if DNS caching delays routing updates, or if the load balancer terminates active client connections without proper connection draining, users will experience errors during the transition.
How does a load balancer support blue-green deployment?
The load balancer serves as the centralized gatekeeper between external users and the backend servers. Instead of updating application binaries directly on the host instances, the load balancer’s routing rules are programmatically updated to point incoming traffic from the active target group (Blue) to the newly validated target group (Green).
What happens to the old environment after a successful release?
After a successful release and a defined observation window (typically anywhere from 1 to 24 hours), the old environment is either powered down to conserve compute costs, kept idle as a rapid-rollback target, or repurposed as the target for the next development cycle.
Can blue-green deployment be implemented with Kubernetes?
Yes. Kubernetes supports blue-green deployments natively using Service selectors, Ingress controllers, or service meshes (such as Istio). By modifying the label selector in a Service definition (e.g., updating version: v1 to version: v2), traffic moves instantly across backend Pod sets.
How should database migrations be handled?
Database migrations must be backward-compatible and decoupled from the application traffic switch. By using the Expand-and-Contract Pattern, engineers introduce non-breaking schema additions (such as new nullable columns) first, deploy the application that reads and writes to both schemas, and only drop old columns after the new application release is established and stable.
Is blue-green deployment better than canary deployment?
Neither strategy is universally superior; they serve different operational needs. Blue-green deployment is simpler to manage and provides an instant 100% rollback mechanism, making it ideal for web applications and monoliths. Canary deployment reduces the blast radius by exposing only a tiny percentage of real user traffic to the update first, making it well-suited for high-scale, distributed microservice environments.
How quickly can a team roll back a blue-green release?
An application rollback in a blue-green deployment can take as little as a few hundred milliseconds to a few seconds. Because the original, stable environment remains fully powered and warm in the background, rolling back simply requires switching the load balancer or proxy back to the original target group.
Final Perspective: Make Every Release Reversible
Software releases will always carry risk, but the true strength of a blue-green deployment strategy is that it transforms hazardous updates into safe, fully reversible operational events. By isolating new code on an idle environment and retaining the previous release in a warm standby state, engineering teams eliminate the panic of failed releases with the ability to roll back traffic in seconds. Achieving this level of reliability requires discipline beyond simple load balancer swapping—it demands strict Infrastructure-as-Code environment parity, disciplined expand-and-contract database migrations, deep automated smoke testing, and proactive telemetry monitoring. When these architectural foundations are firmly established, blue-green deployment turns stressful late-night maintenance windows into predictable, continuous, and zero-downtime milestones across your software delivery lifecycle.
